Note:
Click on the link below a chart to see the chart enlarged and in a
separate window. Also, in the newly opened chart, clicking on it should increase the size. A second click will then bring it back to the
beginning size.
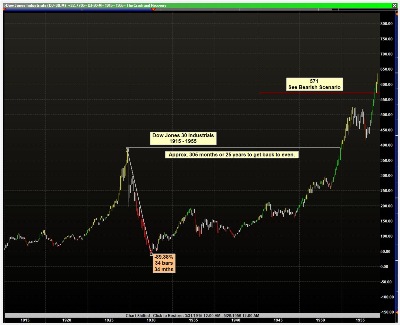
The Roaring 20's and the1929 Crash and Recovery - Natural Laws at work -
Wow! How about this chart !! DOWN 90% in just less than 3 years!!!
That's like the Dow Jones 30 Industrial Average going to its range in 1983 -
1,013 to 1,258 !!!!!
Where are we now?
What will it be like to go through a downmove and recovery like this?
Below are three monthly charts of the Dow Jones
30 Industrials Average that show three scenarios, drawn according to easily learned rules:
(1) Bullish;
(2) Bearish; and
(3) Consolidation.
Look them over and ask yourself these questions:
(1) What if one of these is right?
(2) What do I do?
(3) How do I recognize change occurring?
The concepts and tools, some familiar and some not, used to create and profit from these scenarios, can be effectively used with almost any index or traded security in the financial markets.
“How do I learn to do this myself?”, you might ask.
If that’s your question, then continue on and you will find out.
Dow Jones 30 Industrials Average - Bullish Scenario 2011 - 2021
Don Worden, a man prominent in technical analysis for over 50 years, wrote a "Daily Worden Report" for his sons' TeleChart® technical analysis software. For June 24, 2010 he entitled his Report: "Exercises in Dreaming?"
"...Of course neither the bounce nor the subsequent downward attack has taken place yet, so it is important to remember that these ruminations are merely hypothetical scenarios. But hypothetical scenarios (which, it is true, can be poked fun of as exercises in dreaming) are valuable in establishing real possibilities for the future. Such scenarios are a creative form of practical reasoning..."
=====
NOTE: The bounce occurred on July 7, 2010, 8 trading days later than June 24th from a point about 400 points lower.


 Where are we now?
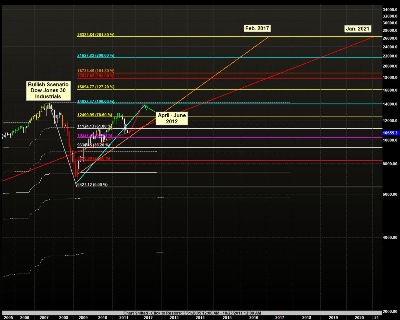 Dow Jones 30 Industrials Average - Bullish Scenario 2011 - 2021
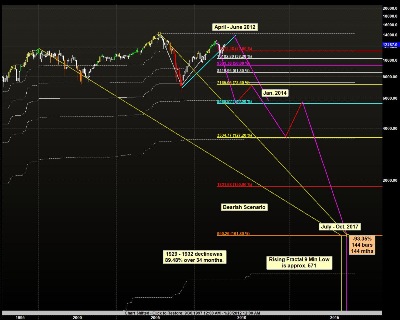 Dow Jones 30 Industrials Average - Bearish Scenario 2011 - 2017
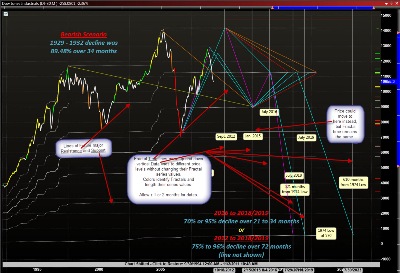 Dow Jones 30 Industrials Average - Consolidation Scenario 2011 - 2019 with possible Bearish resolution